Summary
Through a hands-on experiment, students will gain a simple understanding of how carbon is released from the ice sheet, glaciers, and permafrost and enters into Arctic Watersheds. Next, students will be guided through a StoryMap tour of the Follow the Water Greenland research project. They will be presented with a 24-hour data set retrieved from a pressure transducer and use a mathematical equation to discover the water level. They will do this for their entire data set and then graph the data to show water level and water temperature on the same graph. They will answer questions about the relationship between water temperature and water depth. Finally, they will be presented with a similar graph from a 48 hour period after a heavy rainfall. Students will compare and contrast the graphs and hypothesize about the impacts of heavy rain on Arctic regions and how polar regions are changing. The lesson will end with a classroom discussion about water cycle changes in the Arctic and the implications.
Materials and Preparation
Students:
- Melting Ice Activity:
- Ice cube trays
- Food coloring
- Clock/wrist watch
- Student guide
- Tray
- Rock
- StoryMap Activity:
- Computers
- Study guide
- Pencils
- Graphing:
- Study guide
- Data set
- Pencil
- Ruler
- Colored pencils
Teachers:
You can prepare the ice ahead of time or do that with your class. You will need the teacher guide.
Learning Objectives
Opening Activity
Understanding Water Level in a Changing Arctic_Teacher Guide
Understanding Water Level in a Changing Arctic_Student Guide
The lesson will start with an ice melting experiment that encourages students to make observations about how carbon locked in glaciers, the ice sheet, and permafrost is entering Arctic Watersheds. They will gain a better understanding of how the “characteristics” of these different types of carbon can be traced back to where they originated. They will think about how different colored ice represents permafrost, ice sheet, etc. and how that might impact watersheds in the Arctic. This is modeled for the students when they see the color orange, they will know that the carbon came from the ice sheet and permafrost.
Activity Overview
The lesson will guide students through an ArcGIS StoryMap where they will learn more about Greenland and the Follow the Water research project. Next, students will be given a set of data and an equation to solve for water depth. Once they have solved for water depth (level) they will graph their data. They will also graph water temperature data and answer questions about the relationship between water depth and water temperature. Finally, they will compare their graph another graph taken over a 48-hour period on the same river during the 2025 summer season. They will identify reasons for water increases and decreases and gain a better understanding for how the Arctic water cycle is changing.
If you are unable to use the story map, we’ve also added a Google slide version of the content in the story map. We encourage educators to use the story map link for the most engaging experience for their learners.
Reflection
Questions in the student worksheet will provide them the opportunity to reflect on how the high Arctic is changing. They will need to think critically about water depth and how that shows changes in the watershed and how changes in the watershed impact the water cycle and vice versa.
They will reflect on how unprecedented heavy rain events in the high Arctic create permafrost thaw, ice sheet melt, and the release of carbon into watersheds that ultimately release that excess carbon into the ocean. By looking at graphs they will understand that the Arctic is changing.
References:
Hernandez, J. (2025, March 26). What to know about Pituffik, the only U.S. military base in Greenland. NPR. https://www.npr.org/2025/03/26/nx-s1-5341505/greenland-pituffik-space-military-base
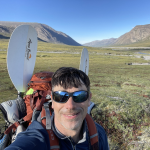
Kuhle,C. (2025). Pressure Transducer Near Pituffik. photograph, Pituffik, Greenland
Qupanuk. (2024, May 23). Welcome to Qannaaq.Youtube.https://www.youtube.com/shorts/lgazajtj2Mk
Qupanuk. (2024, June 25) What is Greenland Called in Greenlandic?. YouTube.https://www.youtube.com/watch?v=e1hHjRciiGfnuk.
Ray, W. (2024, November 7). Following the Water in Greenland.YouTube. https://www.youtube.com/watch?v=1u8e5BciCUg
Wieland, L. (2025). A Gian Iceberg Near Qaanaaq. Photograph, Qaanaaq, Greenland.
Standards:
Polar Literacy Principles:
Resource Developed By
To learn more about this project
View ProjectMade possible with funding by the U.S. National Science Foundation Award #2221990. The information contained here is those of the author(s) and does not necessarily reflect the views of the U.S. National Science Foundation.