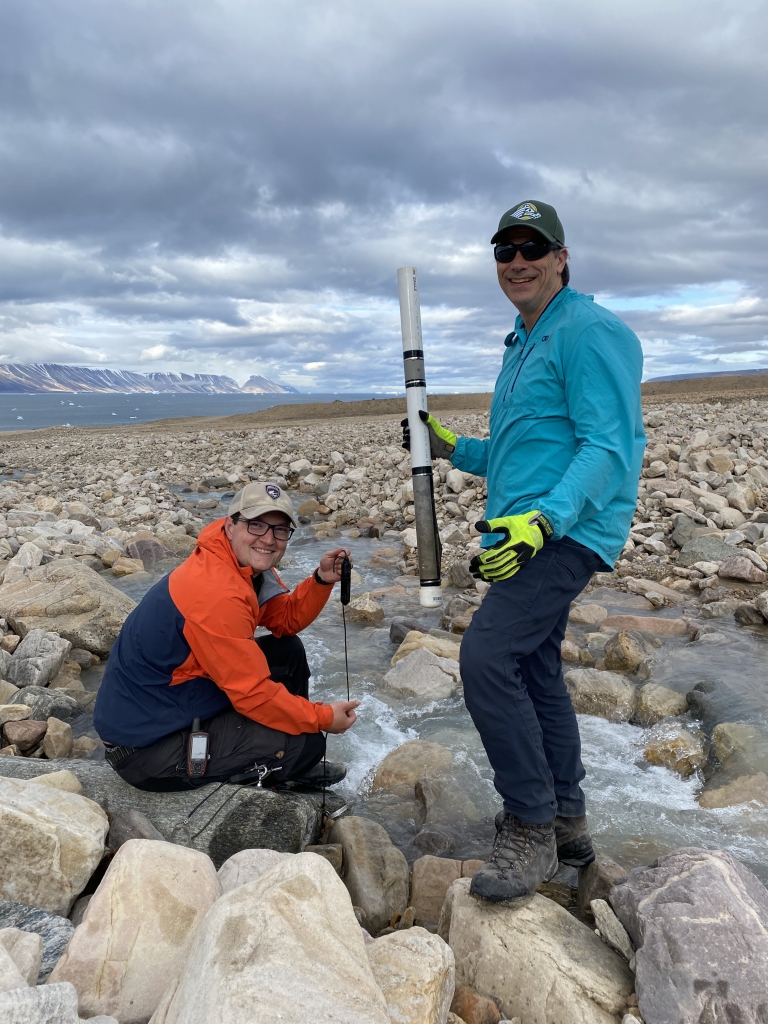
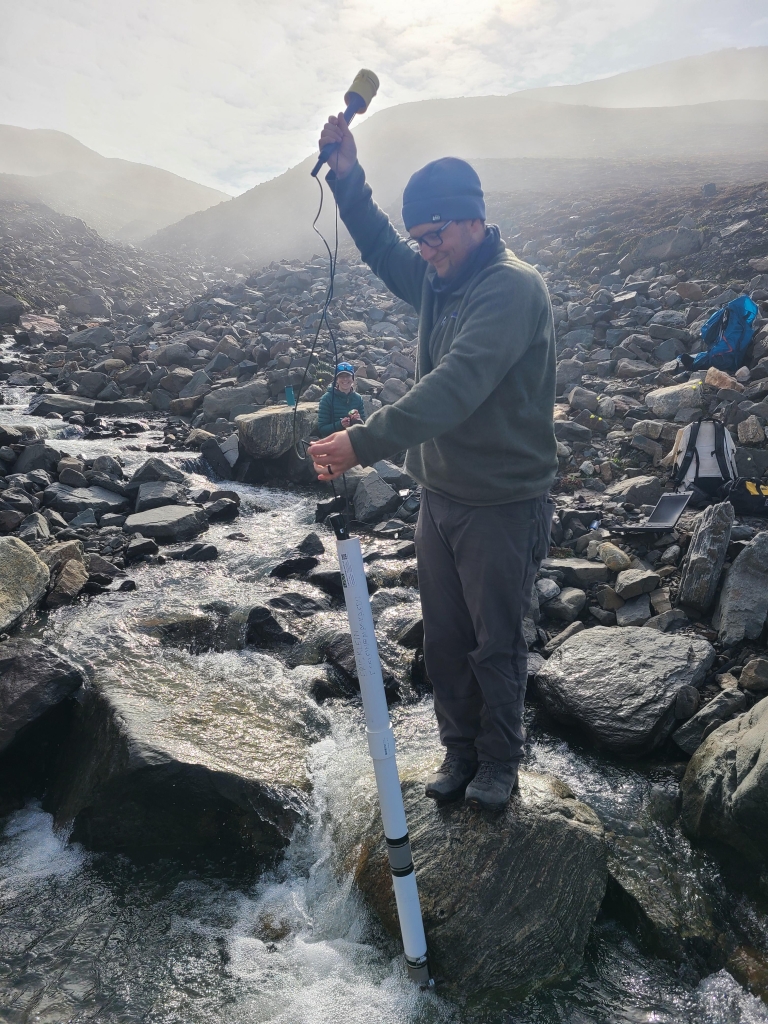
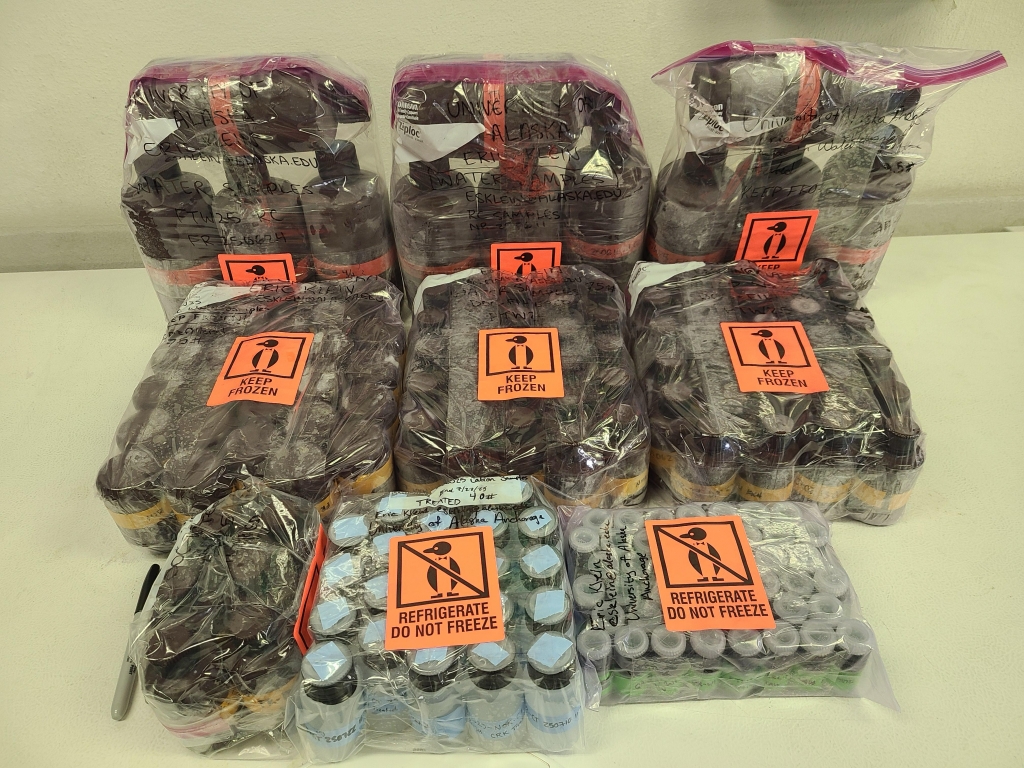
It’s early July, but in Qaanaaq, Kalaallit Nunaat (Greenland) Dr. Eric Klein and his research team are preparing for winter. They are retrieving pressure transducers (data loggers) that measure water level and temperature from the West Qaanaaq River and uploading the data onto a field computer. It’s exciting to see the data come to life on the screen. The spikes in the data show when the fall freeze occurred in mid-September 2024, and the spring thaw in late June 2025. Talk about a short summer season! Once the data are saved and cleared from the pressure transducer, they slip it into a latex tube filled with glycerin, a non-toxic antifreeze solution, and slide it back into its protective case bolted and chained to a boulder near the edge of the river. We wish it luck and move onto the next site, where the procedure will be repeated.
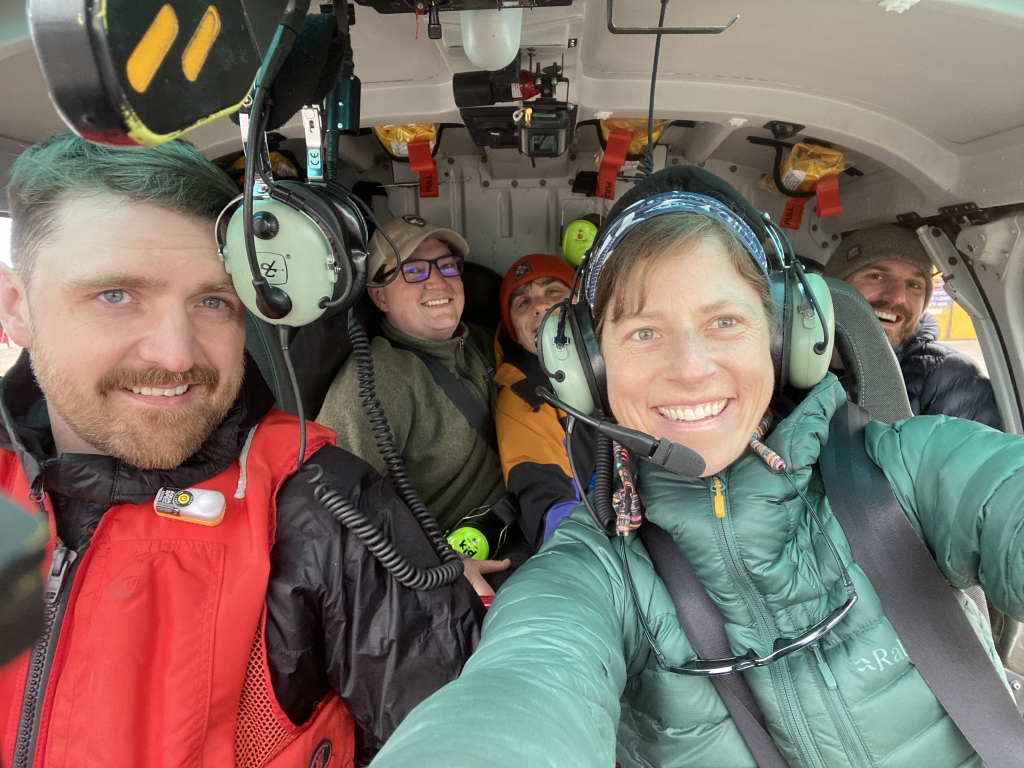
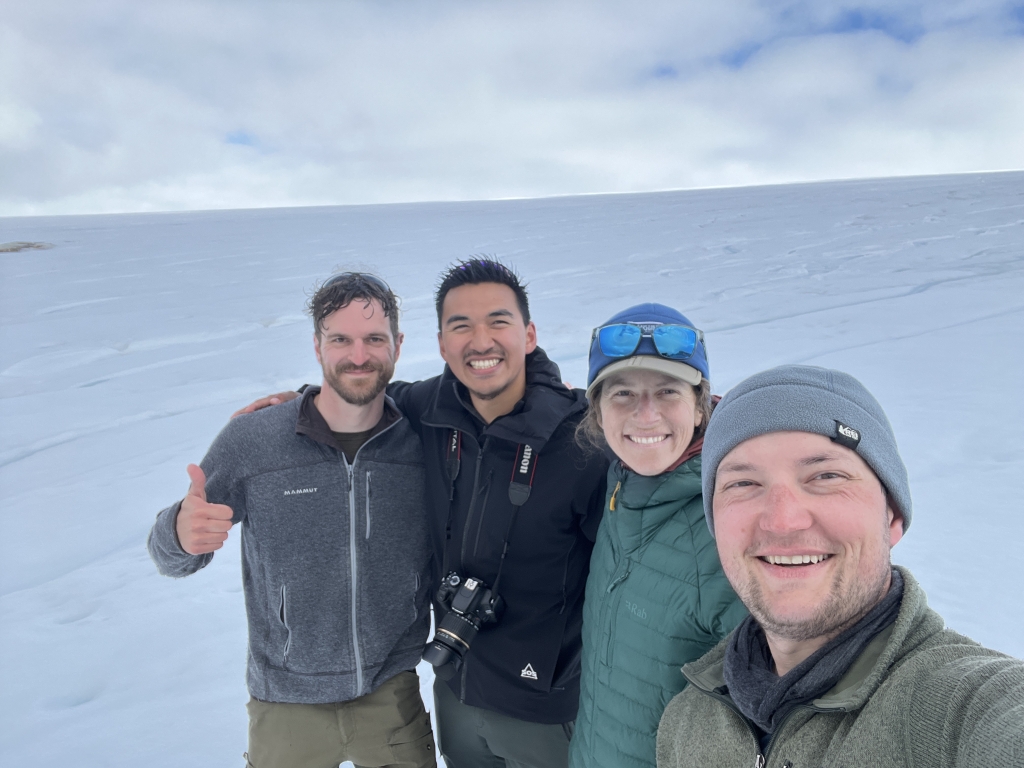
Dr. Klein, a Geology professor at the University of Alaska Anchorage, is leading the Follow the Water Project to better understand river discharge dynamics in rapidly changing high northern latitudes. As a Polar STEAM fellow, I got to join his research team, which consisted of two PhD students Logan Wieland and Cameron Kuhle from the University of Alaska Anchorage, and Aqqalualiit Broberg from llisimatusarfik (University of Greenland). The team is trying to understand how shifts in air temperature, caused by an increase in atmospheric carbon dioxide, are causing changes in the cryosphere, or parts of the Earth’s surface that are frozen, and subsequently the Arctic water cycle. They are studying watershed systems that are fed by peripheral glaciers, not directly connected to the ice sheet, and others fed by outlet glaciers that are connected. The research is taking place in Qaanaaq and Pituffik, Greenland.
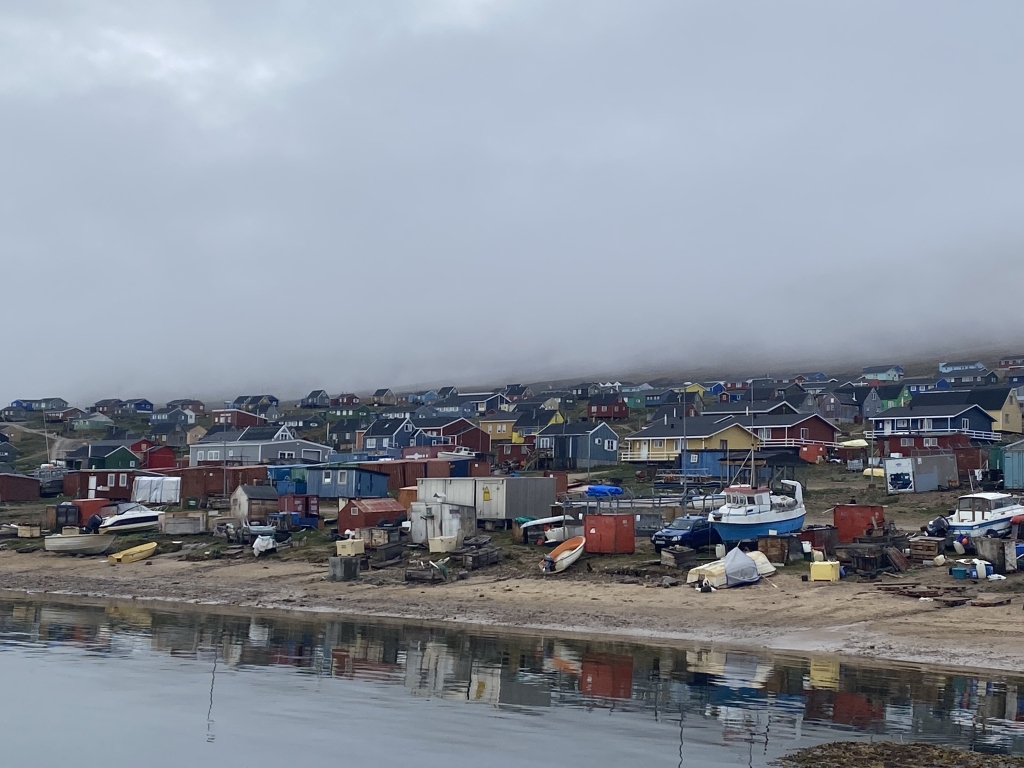
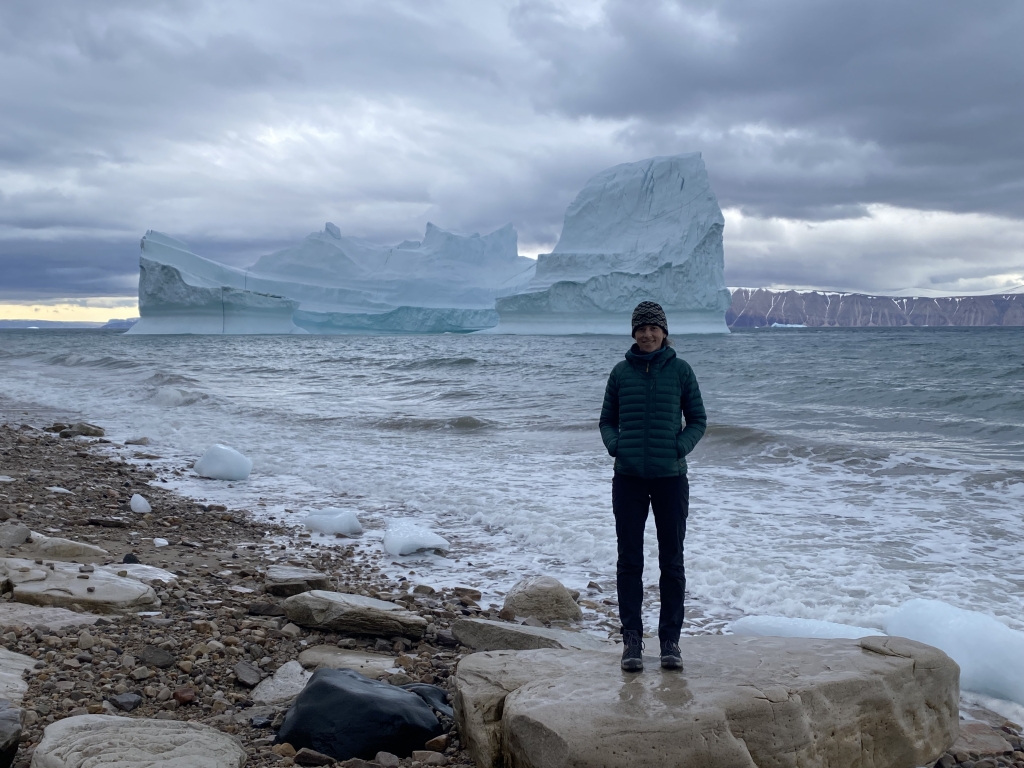
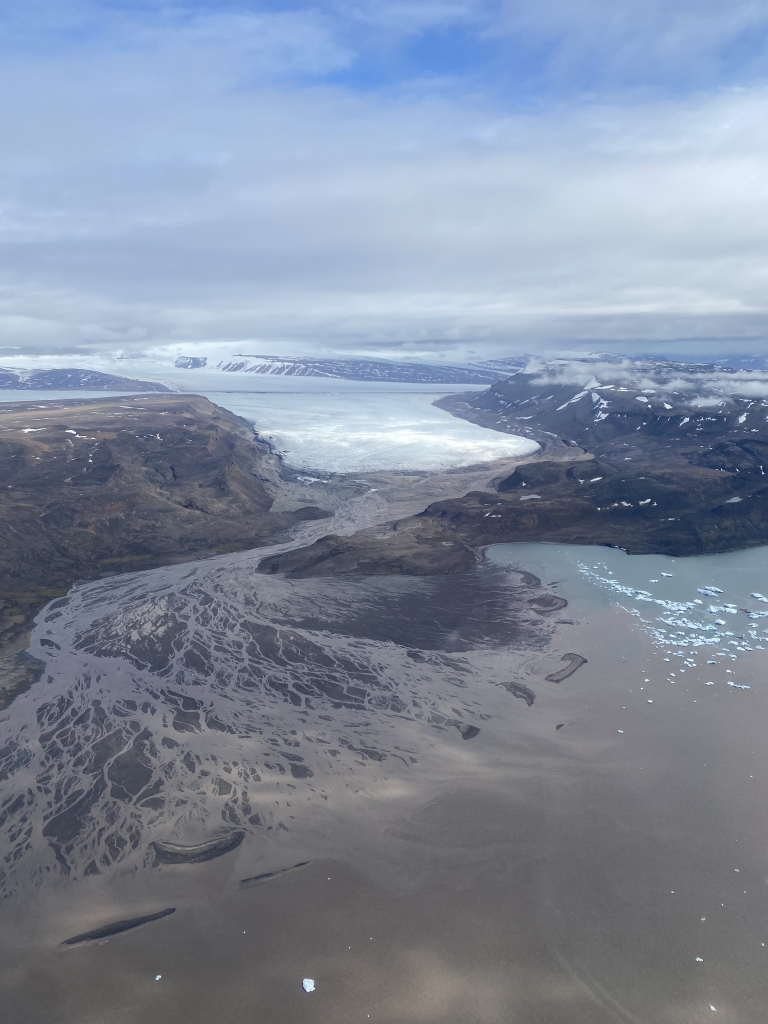
We spent two weeks in Qaanaaq, which is located at 77°N. It is WAY above the Arctic Circle and historically has been considered a polar desert. However, as the atmospheric temperature rises, changes in the cryosphere are resulting in more water in the atmosphere. Glaciers and the ice sheet store water, but with the reduction of glacial mass comes the loss of water. However, the water doesn’t just disappear, it goes back into the atmosphere through the hydrological cycle which leads to more rain and clouds.
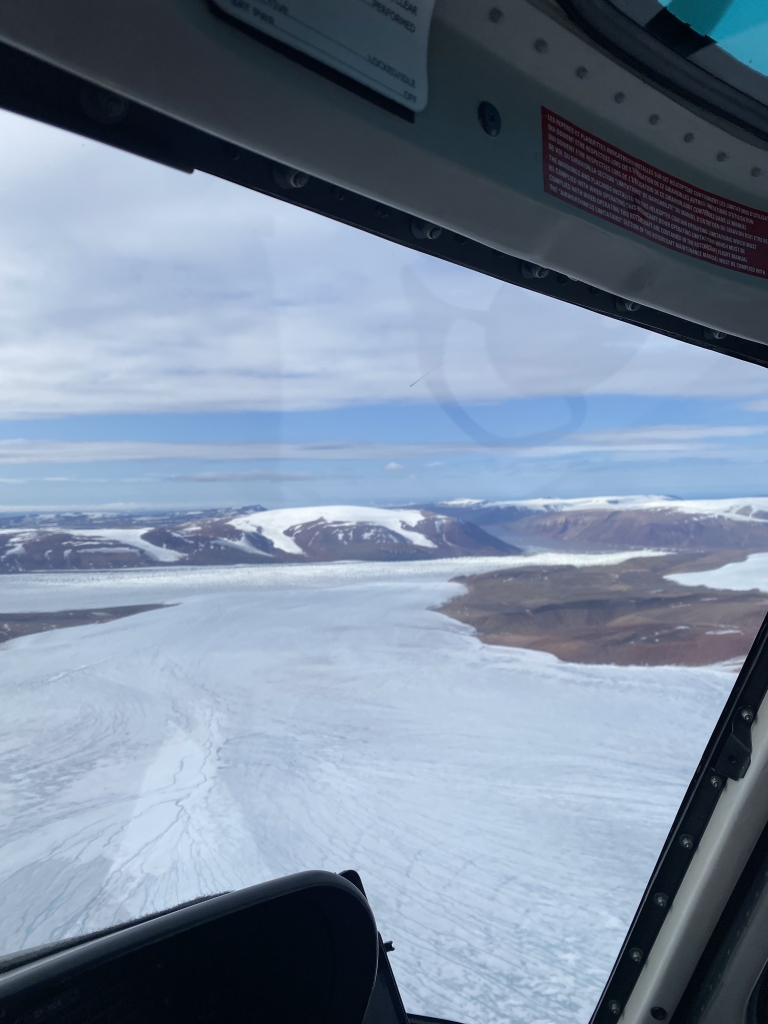
The changes in the hydrological cycle were very obvious during our short stay in Qaanaaq. We experienced a variety of weather including heavy rain and fog which is atypical for this Arctic region. The abnormal weather held us captive in Qaanaaq for an additional week since helicopter travel was impossible in those conditions.
The Arctic is changing four times faster than any other part of the planet and these changes cause various impacts on different Earth systems. In the past, the Arctic was much cooler and most of the water was frozen for at least part of the year. In this changing Arctic, some of the water that was previously locked in the sea ice or ice sheet is evaporating and entering the atmosphere creating changes in weather patterns, or it is melting and entering surface streams changing river flow.
To better understand these changes, Dr. Klein’s team is looking at three main characteristics of these Arctic watersheds. They’re studying the volume of water flowing through river systems, the timing for spikes in water flow, and the characteristics of the water.
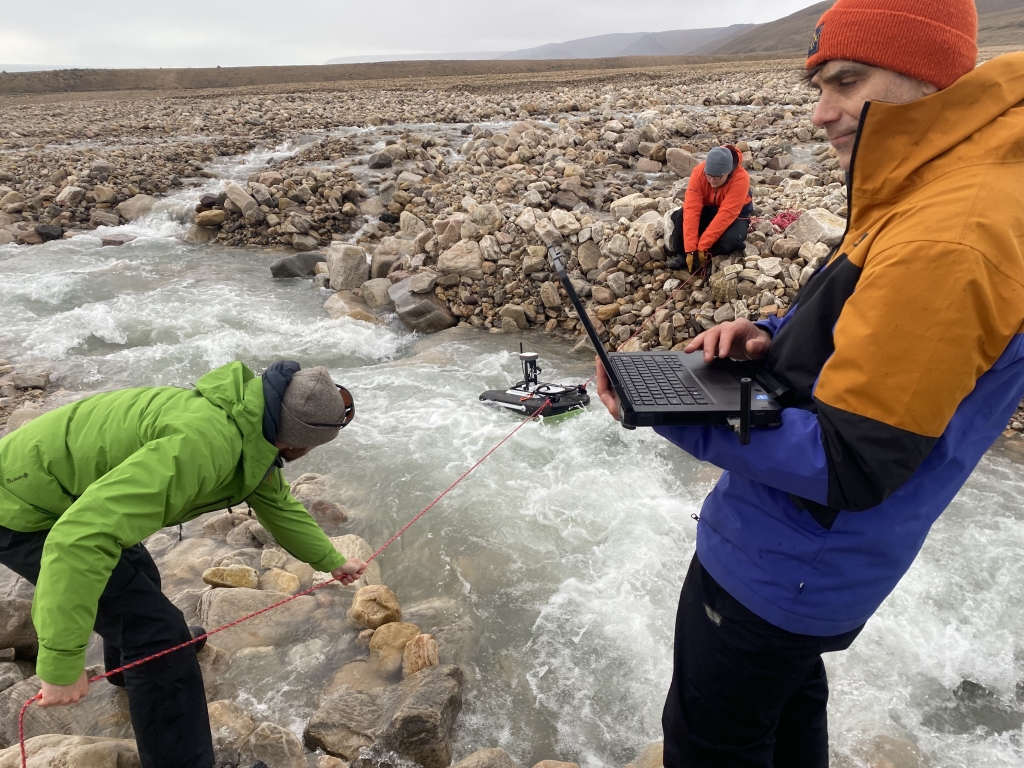
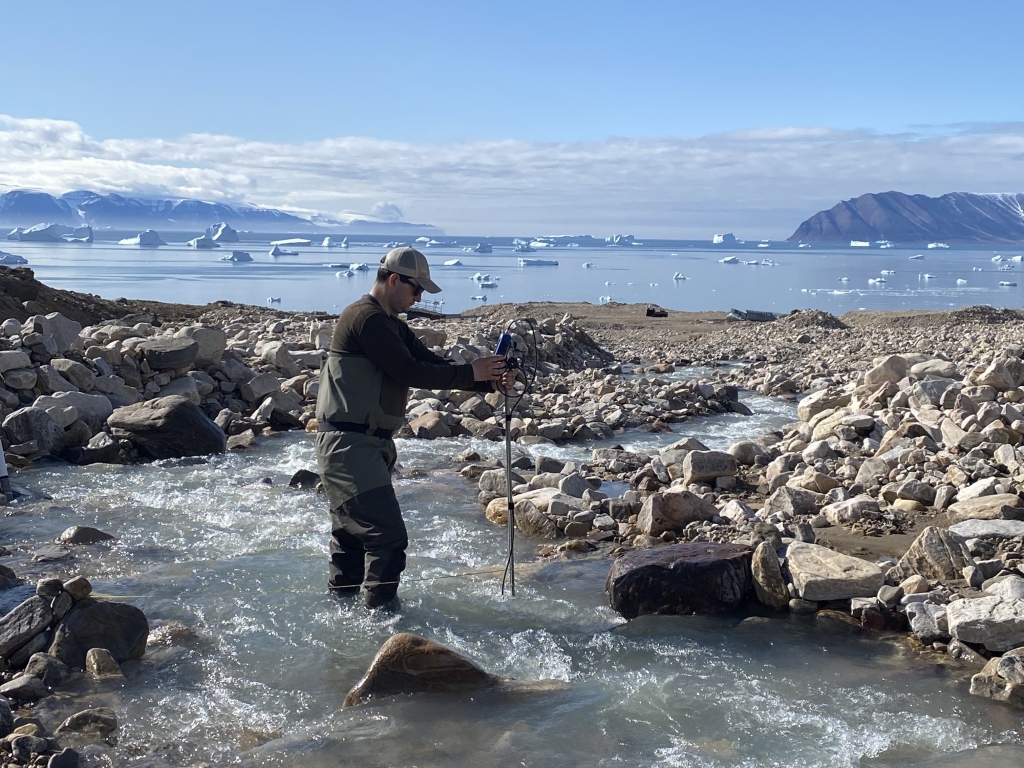
The river discharge, or volume of water, is measured in cubic meters per second with a flow meter or Acoustic Doppler Current Profiler (ADCP). This gives the researchers more information about water flowing through a specific location. If the river wasn’t too high, a Water Flow Meter was used, but after a storm the team would work together to use the ADCP. Picture a paddle board with ropes attached to the sides and scientific equipment strapped to the top. To use this piece of equipment, Logan would go to one side of the river and Cameron to the other. They would use the ropes to pull the ADCP across the width of the river while real time data were collected on a field computer that Dr. Klein was running. The ADCP is a hydroacoustic current meter that uses soundwaves to measure water volume. This is done through the Doppler effect. The equipment transmits sound waves into the water and the frequency of the returning echoes determine the velocity of the water at various depths.
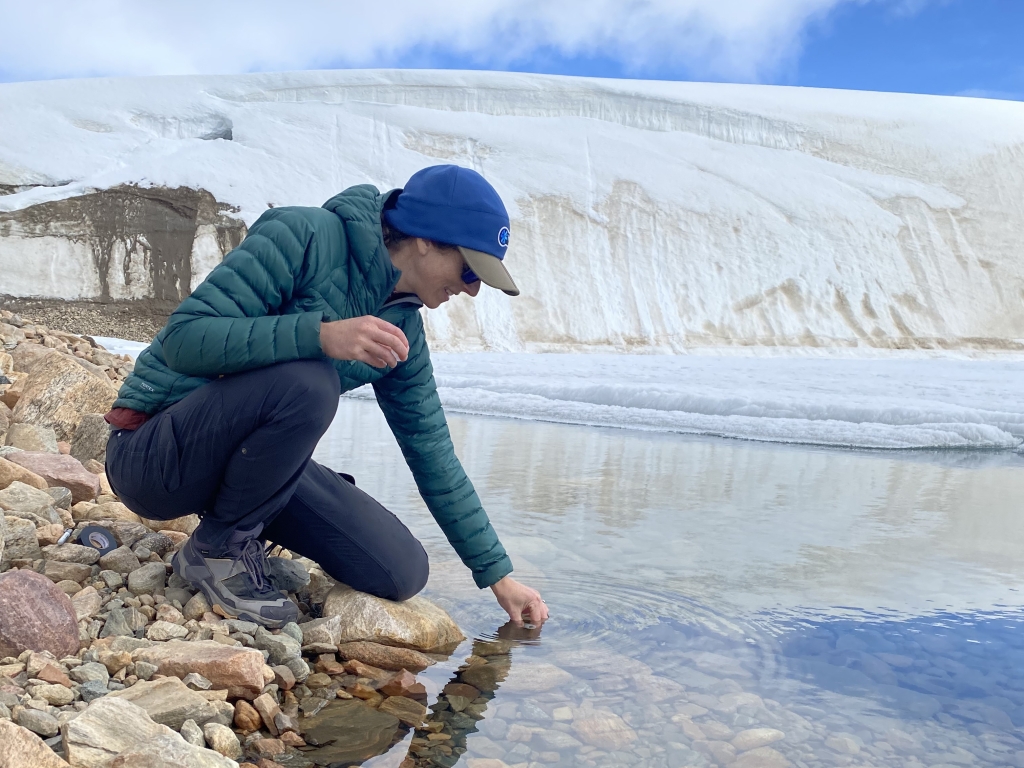
I assisted with water quality collection, which helps the team understand the characteristics of these Arctic watersheds. These samples included dissolved organic carbon, which is collected by running samples through a filter, a challenging task after a storm when extra silt was swirling around in the rivers. Some of the easier samples to collect were water stable isotopes and cations that could simply be scooped up into the collection bottles.
The samples will be processed in the lab back in Anchorage. The contents will help the researchers understand what is in the water and where it comes from. For example, permafrost thaw has different characteristics from ice sheet melt, which is different from rainwater. The water isotope samples tell the team how much of the contents of the river are rainwater, ground water, or snow and how shifts from different sources are impacting what is in the river water.
To understand the timing for water volume increases and decreases, the team uses pressure transducers that take continuous measurements of water level. These instruments are installed at all five sites in Qaanaaq and Pituffik and run year-round. This information helps researchers understand how a warmer and wetter Arctic affects the timing of peak flow, freeze-up, and thaw.
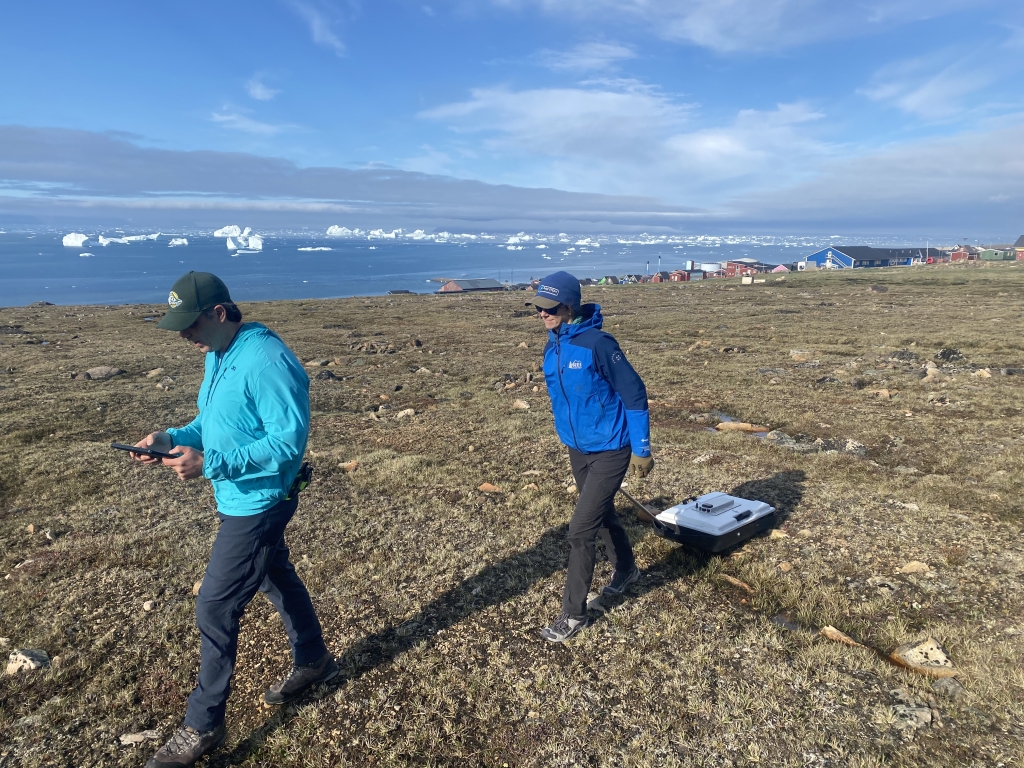
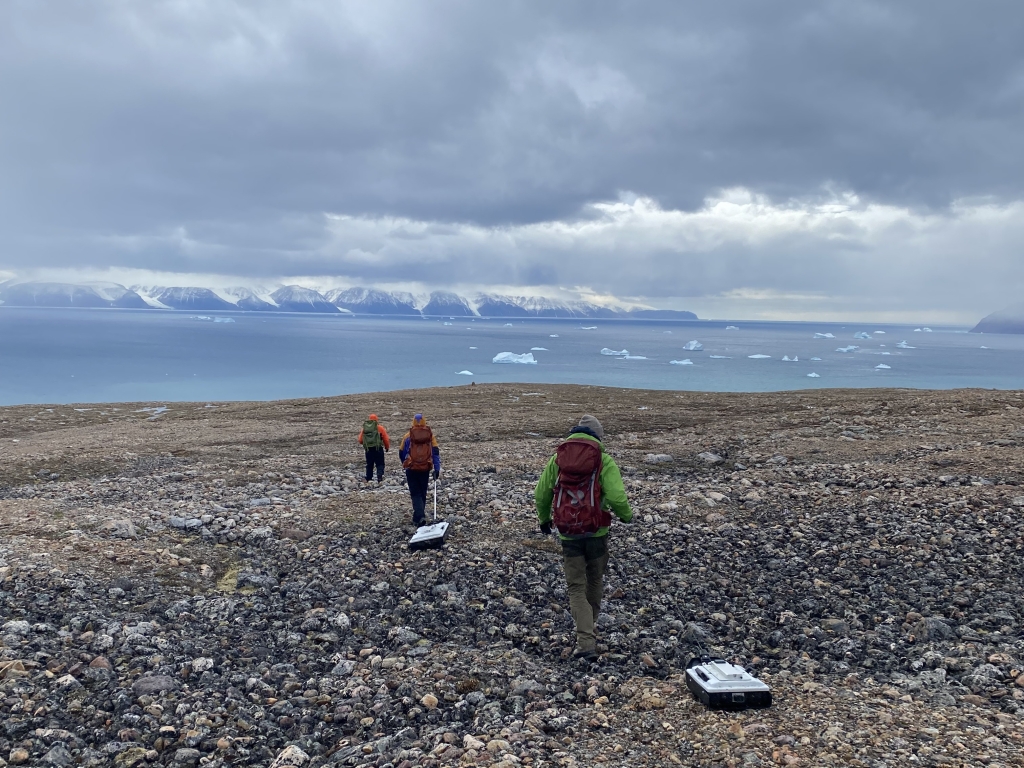
Another measurement I got to help with was the Ground Penetrating Radar (GPR). This instrument is about the size of a lawn mower, and it is pulled across the tundra. We would work in teams, one person pulling the GPR while the other collected data on the iPad and set the course. GPR works by sending a radio signal that maps subsurface features that can be used to estimate different layers below your feet. It measures features like the depth of organic soil, glacial mineral soil, and changes in the density of soil. It provides the team with information about ground ice features, like permafrost, and depth of the active layer, or the layer of permafrost that thaws seasonally.
Permafrost is ground that is frozen for at least two consecutive years. The warmer air temperatures and rain are increasing the depth of the permafrost table and the seasonal thaw. The GPR gives the scientists more information about the depth of the active layers and the depth of the permafrost and how that varies across different landscape features. The changes in depth of permafrost are impacting the amount of water in the watershed and the timing of when water is released. These changes also influence the amount and types of elements and nutrients that wash through the watershed. This can have impacts not only on the hydrological cycle, but can also have implications for intertidal food chains.
Eventually the clouds lifted, and we were able to fly back to Pituffik. We had missed the weekly flight from Pituffik back to Baltimore, and after rearranging my schedule with frantic phone calls and emails, I was able to enjoy an additional week in Greenland. We continued to take measurements at sites around the Pituffik Space Base and ventured onto the ice sheet to gather water quality measurements. When Friday rolled around, so did the clouds, but the weekly flight to Baltimore ran as scheduled. As I watched the ice sheet disappear from sight, I was filled with gratitude for this amazing, life-changing opportunity to experience and participate in a polar research project collecting field data that are essential for understanding a changing Arctic.
Written by Tracy Wirak-Cassidy- Polar STEAM fellow and Dr. Eric Klein lead researcher on the Follow the Water Project