Summary
Earth is a dynamic system and its changes, over both long and short term timescales, have been recorded in ice. Ice cores, extracted from ice sheets, contain preserved layers of snowfall, trapped gases, dust, ash and soot. These layers provide insight into changes in Earth’s atmospheric geochemistry. To better understand, interpret and apply the chemical element data across ice core records and a global climate context, scientists need to correlate specific ice core depths to time. In this lesson, students analyze authentic ice core data, including measures of Electrical Conductivity (ECM), Black Carbon, Sulfur, and Sodium. These particular chemicals appear in the atmosphere in cyclical patterns (ie: show an increase in one season and a decrease in another) and can therefore be used to identify annual layers within the ice.
Materials and Preparation
Listening to Melting Ice
In the opening activity, students listen to melting ice. Educators can use the video provided or create the opportunity for students to listen to actual ice melt with the materials listed below (or do both).
- Video: Melting Ice
- Scraps of Ice Cores obtained from NSF Ice Core Facility. Email: Curt La Bombard/Richard Nunn, Curator/Assistant Curator, National Ice Core Facility or call (303) 202-4830 to begin the sample allocation form process. Plan to pay for shipping by fed-ex priority overnight/2 day service and to send an insulated box (with packing material that can be frozen for shipment) in advance.
- Water-proof Stereo Contact Microphone / Piezo Transducer Pickup / ASMR Microphone / Hydrophone (1/4″) (about $34)
- Plastic container to hold water and melting ice (ie: beaker, bucket or repurposed food container)
- Headphones compatible with recorder (if students listening to audio individually)
Analyzing Ice Core Signals
- Printed 11”x 17” Graphs (1 copy per team) – These may be laminated so groups can write on them and they can be reused over multiple classes/years. Cut Graphs 2 and 3 and Graphs 4 and 5 apart along the dotted line.
- Fine point Markers (wet/dry erase if using laminated graphs) – 1 per team
- Background reading sheets (1 copy per team)
Torn paper ice core art
- Variety of paper colors/patterns
- Glue
- Scissors
- Markers/Pens
Learning Objectives
Opening Activity
Students listen to the sounds melting ice makes. This may be through using a microphone, recorder and headphones to listen to melting physical ice submerged in a bucket of water or it may be using the provided video/audio recording (see materials list).
Students are prompted to brainstorm ideas of why the ice is making these noises.
Questions to explore with students before, during and after activity/video:
- What is happening to the ice?
- What is the cause of all the different sounds/noises? or Why does the ice make noise as it melts?
Author’s Note: Students might wonder if ice in their home freezer would sound the same. I wondered the same thing but haven’t tested it myself but based on the following, my guess is that it would not sound the same. Ice core ice is different from ice cubes in your freezer which froze rapidly and captured the air immediately surrounding them. Regular ice cubes trap air representing current atmospheric composition, while ice cores capture air from past climates.
Activity Overview
Use the instructors Guide for the full activity.
Key points Covered:
Ice Cores & Atmospheric Data:
- Ice cores provide a record of Earth’s air composition, temperature, and snow accumulation over time.
- Dust, ash, soot, and other chemicals within these layers reflect seasonal fluctuations, allowing scientists to distinguish annual cycles.
- Scientists need to know the time associated with different depths of an ice core to confidently interpret the data.
Scientific Techniques:
- ECM (Electrical Conductivity Measurements): Detects changes in acidity, helping scientists identify significant environmental events. Video: Running an EMC at National Ice Core Facility
- Other Chemical Markers (Black Carbon, Sulfur, Sodium): Provide further evidence of atmospheric changes and seasonal patterns.
Reflection
– Group Reflection: Each group will summarize their findings and reflect on what they learned about how ice cores provide insight into past climate conditions.
– Optional Assessment: Teacher will assess understanding through group discussions and compare estimates to actual data. Each student will wrap up the activity by using their group graph and ideas discussed as a team to create an annotated torn paper ice core art piece representing 1-2 take-aways from the lesson.
Supporting Documents
NGSS Standards:
- HS-ESS2-4: Use a model to describe how variations in the flow of energy into and out of Earth’s systems result in changes in climate.
- HS-ESS3-5: Analyze geoscience data to make claims about modern and historical climate change.
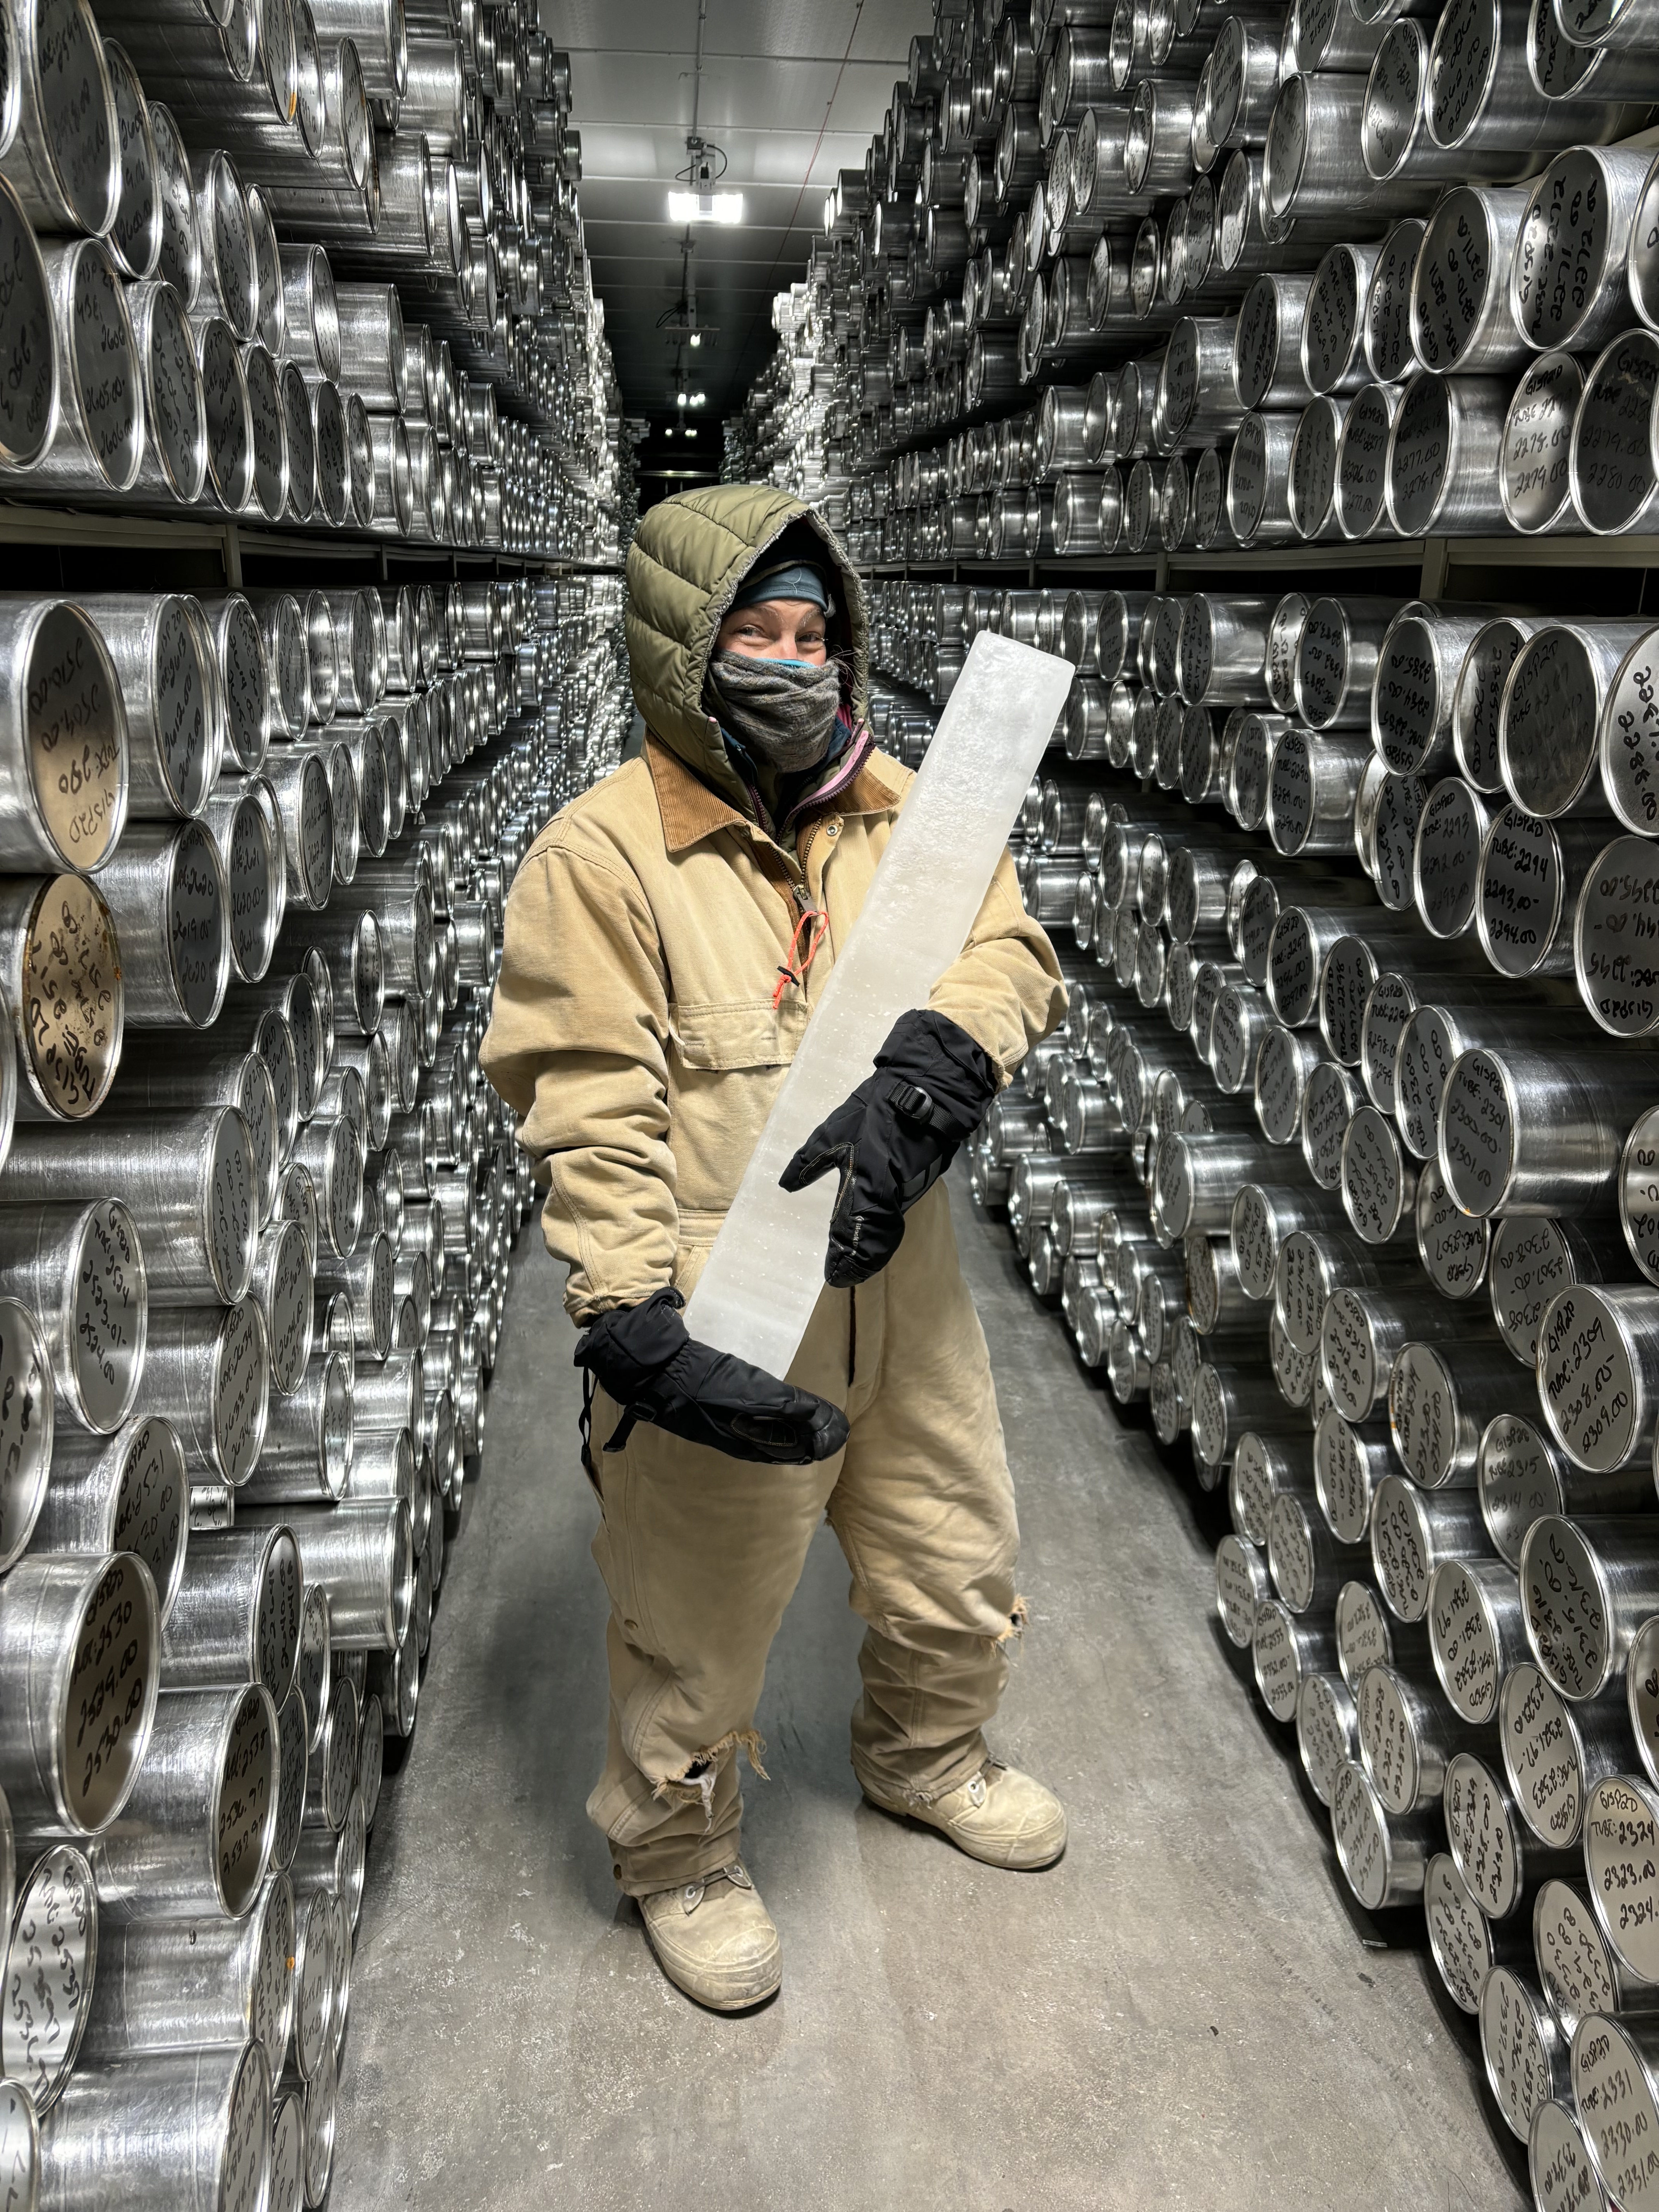
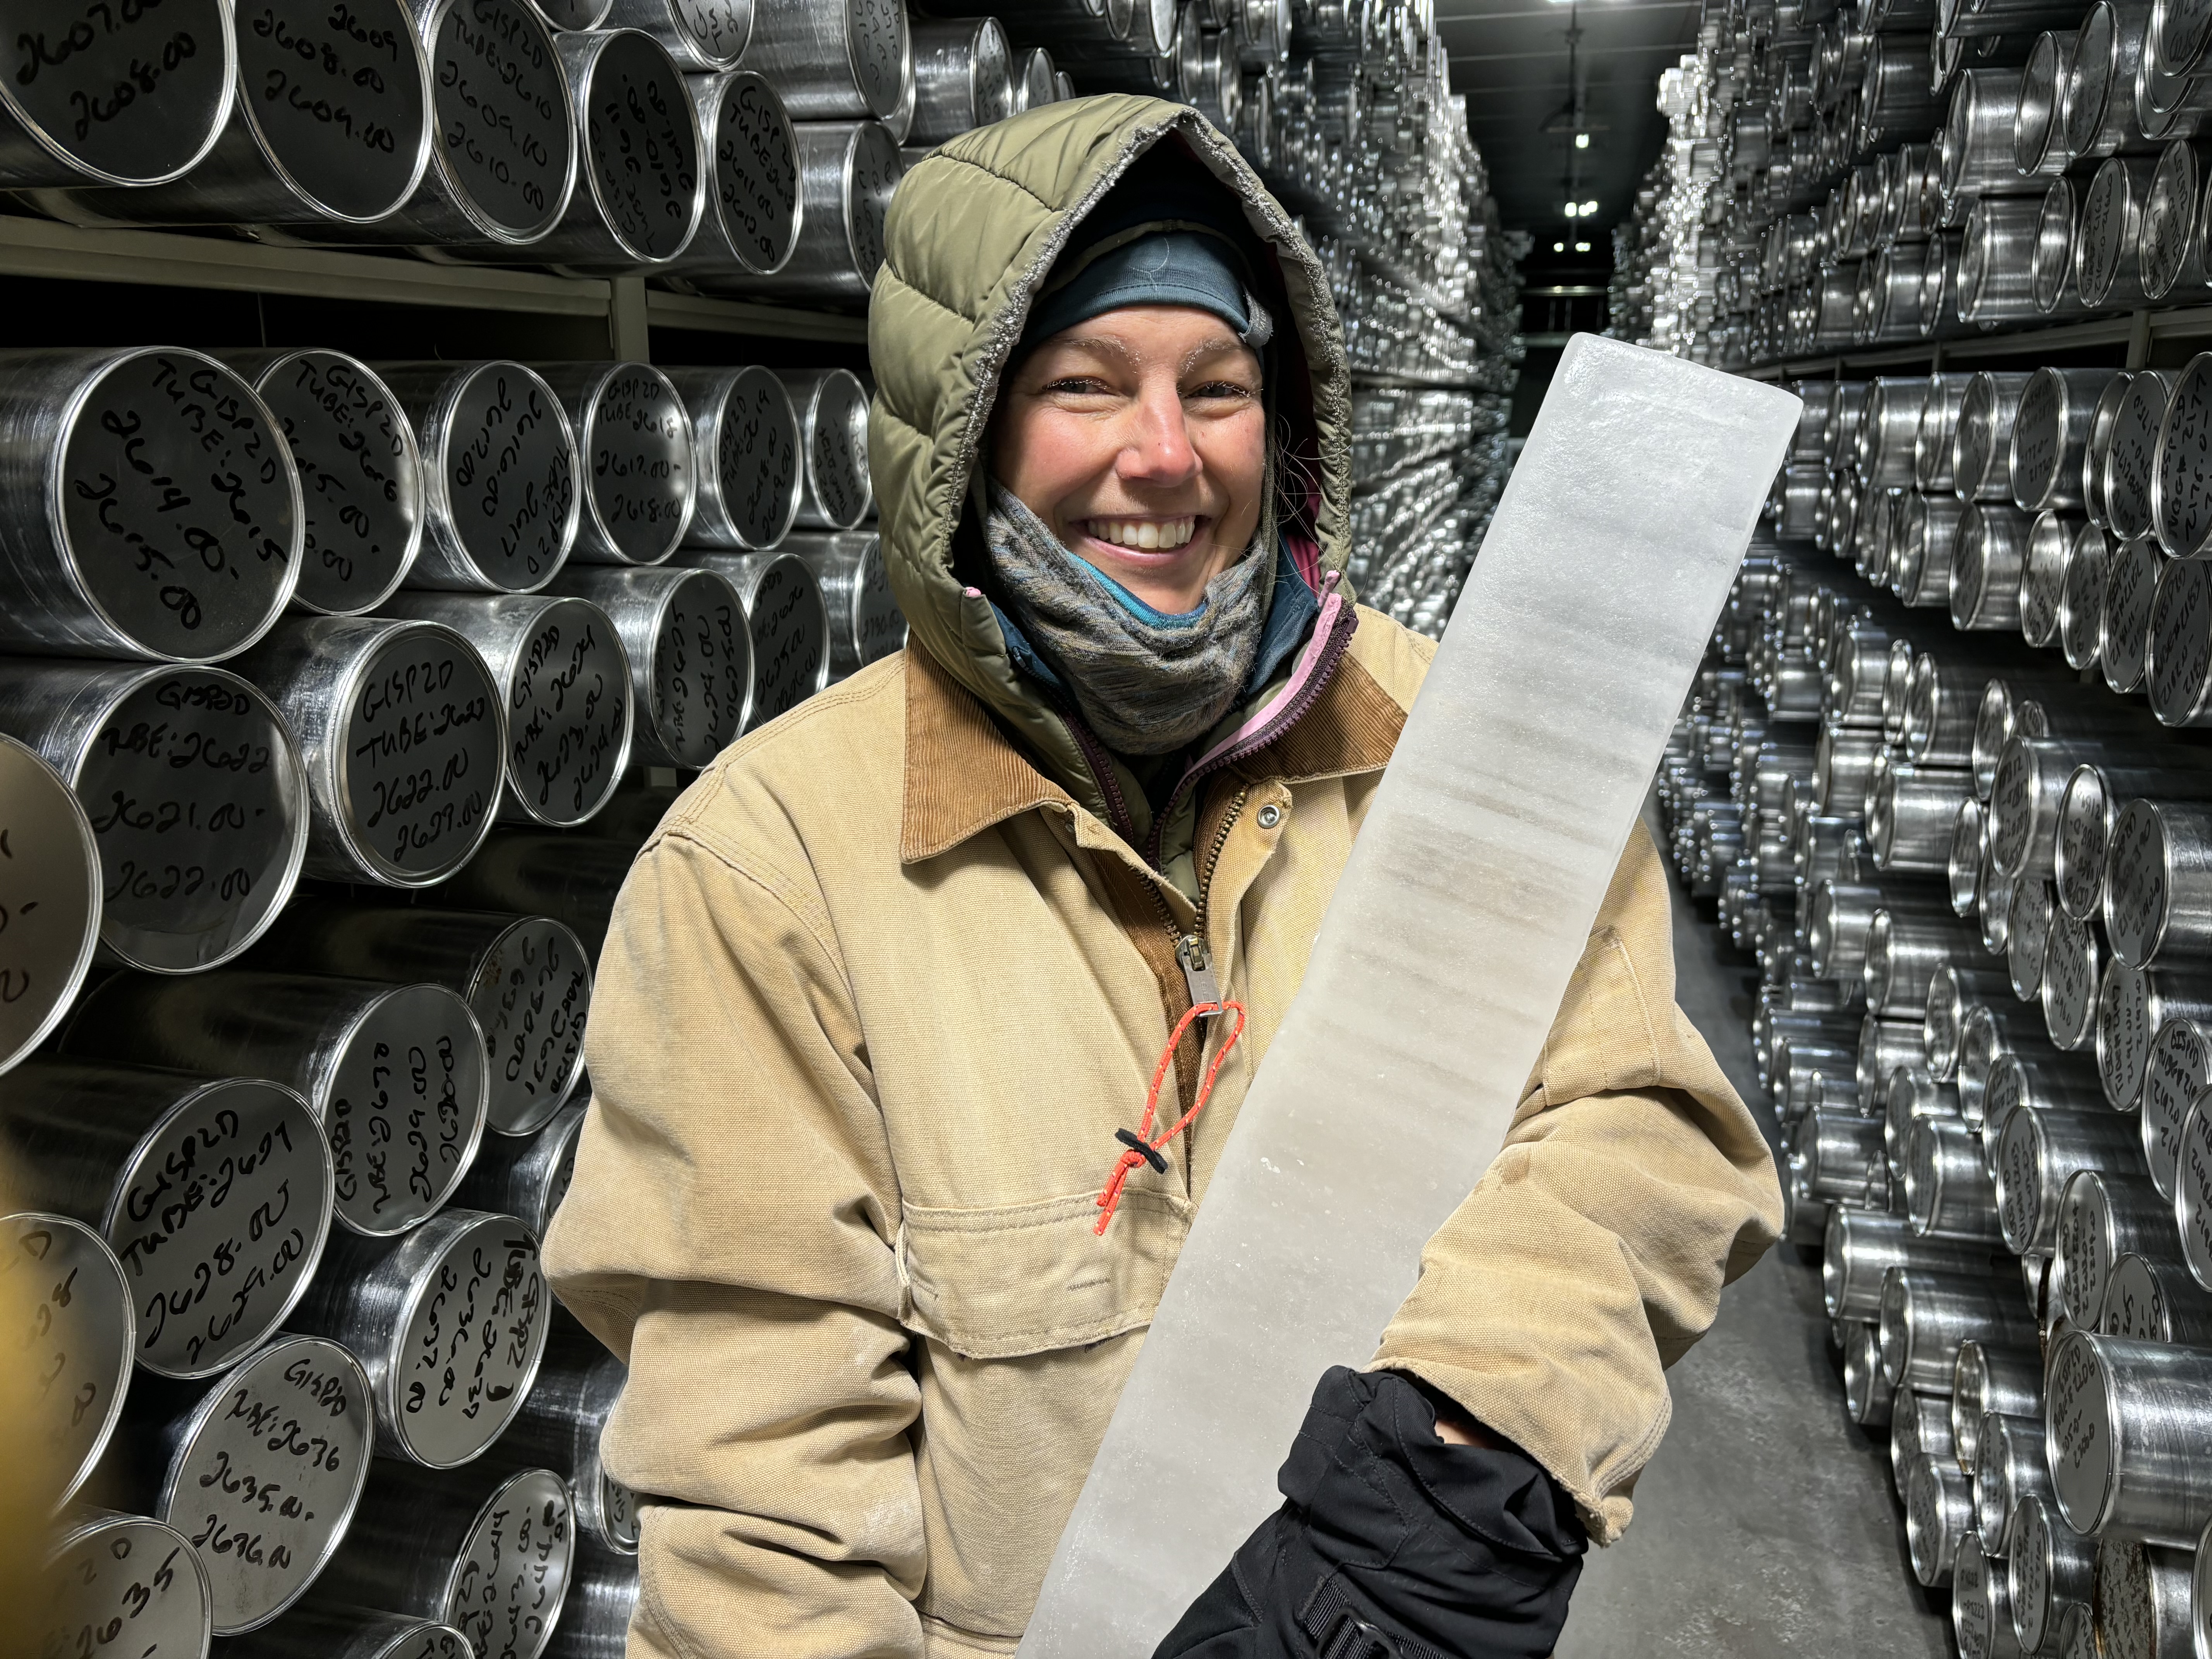
Ice Core Images:
Additional Resources
- EGU Blogs, Ice Cores “For Dummies”
- Stories in Ice: Calendars in Ice
- Frozen in Time: Climate Clues Hidden in Ice
- Putting the time in time machine: Methods to date ice cores
References:
Collaborator: T.J. Fudge, College of the Environment, University of Washington
National Science Foundation Ice Core Facility
Ice core data is available at:
Fudge, T. J., & Taylor, K. C. (2014) “WAIS Divide Ice Core Electrical Conductance Measurements, Antarctica” U.S. Antarctic Program (USAP) Data Center.
Sulfur, Sodium, and Black Carbon Dataset
McConnell, J. (2017) “WAIS Divide Ice-Core Aerosol Records from 1300 to 3404 m” U.S. Antarctic Program (USAP) Data Center.
Thank you for the melting ice audio: Jayme Collins, Blue Lab, Princeton University
NGSS Science Standards:
Polar Literacy Principles:
New technologies, sensors and tools — as well as new applications of existing technologies — are expanding scientists’ abilities to study the land, ice, ocean, atmosphere and living creatures of the Polar Regions.
Resource Developed By


To learn more about this project
View ProjectMade possible with funding by the U.S. National Science Foundation Award #2221990. The information contained here is those of the author(s) and does not necessarily reflect the views of the U.S. National Science Foundation.